Northwind Traders is a fictional company database created by Microsoft to demonstrate their software related to business intelligence. For this project I was tasked with exploring the database and extracting useful business intelligence from it. The questions that I chose to answer are as follows:
- Do discounts increase quantity sold and if so, what is the optimal discount for increasing quantity?
- Do discounts increase revenue and if so,what is the optimal discount for increasing revenue?
- Do discounts increase the quantity sold for certain product groups?
- Do discounts increase revenue for certain product groups?
- Are any products more popular in their local markets than in foreign markets?
- Is there a “cheapest shipper” for each shipping route?
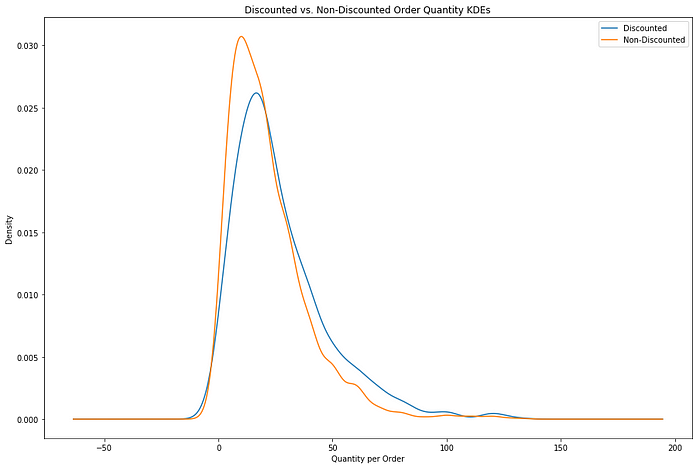
To answer the first four questions I merged data from several files within the database including “Orders”, “Order Details” and “Products”. I then split the resulting dataframe into those orders that were discounted and those that were not. Below is the distribution chart for the discounted and non-discounted orders. As we can see, the discounted orders skew toward a higher quantity per order than those of the non-discounted. Using Welch’s t-test we can confirm with a high degree of certainty that discounted orders do indeed have an average order quantity of 6.2 units higher than those without discounts.
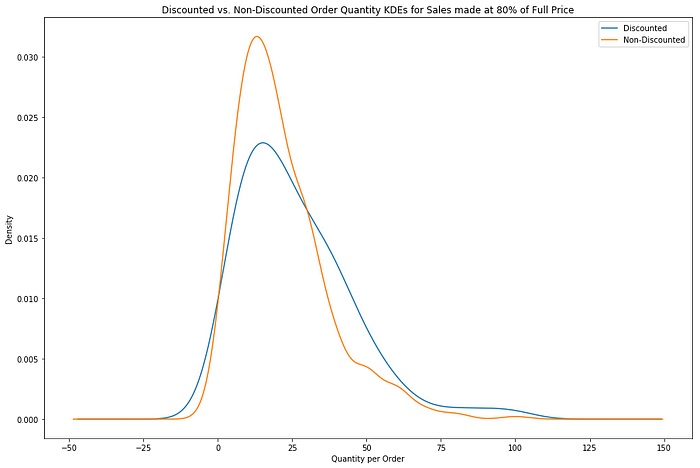
 A little deeper digging into the data reveals another way to answer this question. There were two different “base price regimes” throughout the period that this data covers. What I mean by that is at the chronological start of the data, each product had a “base price” from which discounts were often given, but then around April of 2013 all of these base prices were increased by 25% to form the current base price regime. This gives us a very unique opportunity to compare sales made at the same end purchase price but as a result of a discount or not. For example, before April 2013 a product might have had a base price of $8 and but now has a base price of $10. We can compare the orders sold at the original “full price” $8 against those of the “20% discount” $8. Below is the chart of that scenario and we can see that even when out of pocket price is constant, that discounted orders are 2.3 units greater and have a p-value of .021, making the conclusion statistically significant.
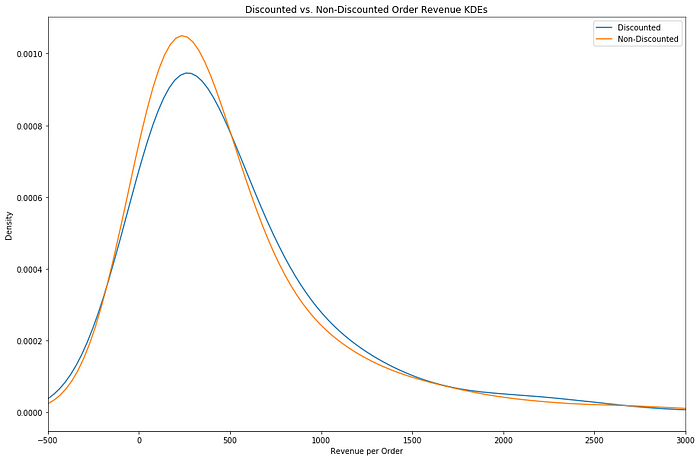
 This may seem like great news and that we can increase sales by offering discounts, but we need to examine the effect that discounts have on revenue to have a more complete picture. When we do the same analysis for revenue per order (base price)(discount)(quantity), we find that there is not a statistically significant difference between the two groups (see image below). Translated to English that basically means that customers are spending the same amount per order but simply receiving more product for the same amount of money, meaning that Northwind’s profits are being squeezed.
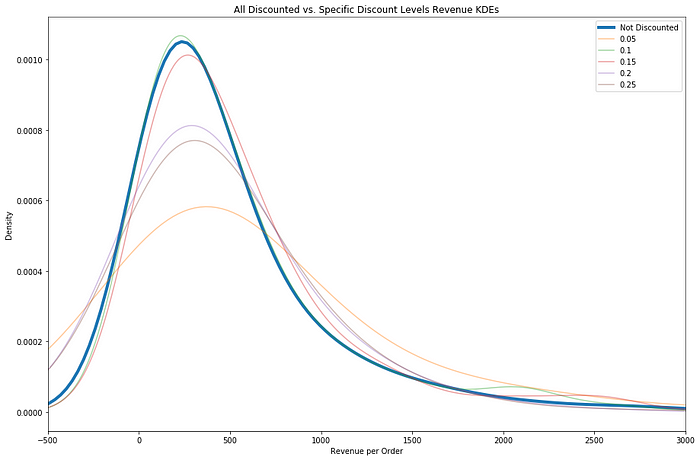
 We can see this phenomenon of stagnant revenue per order at all levels of discount when compared to non-discounted orders. In the image below, only the 5% discount (yellow line) is statistically significant and its increase is only $2 per order, meaning that its real word effect is likely negligible.
 Continuing this analysis further we can examine the effect of discounts on the seven different product groups, but there again we find the same conclusion. Discounts do increase the quantity sold in several product groups but discounts do not increase the revenue for any product groups. This again bolsters my conclusion that Northwind Traders should not offer discounts.
The question of “are any products more popular in their local markets than in foreign markets?” yields some interesting findings. To explore this I merged data from the “Orders”, “Order Details”, “Products” and “Suppliers” files and for each product grouped orders into buckets of orders sent to the same region as production and another for order sent to regions outside of production. I call these “local” and “foreign” orders respectively. There were only seven products of all 77 that showed a statistically significant difference between local and foreign revenue per order. The products that were more popular locally were Chocolade, Camembert Pierrot and Sirop d’érable; the products that were more popular in foreign markets were Gustaf’s Knäckebröd, Ravioli Angelo, Louisiana Hot Spiced Okra and Scottish Longbreads. To be honest, I have no idea what most of those are and also do not know what business intelligence can be derived from it but I found it interesting.
The last question is if there is a cheapest shipper. For preliminary analysis we can simply compare the distributions of the price of freight per order for each of the three shipping companies. Results from this show, with statistical significance, that Speedy Express is cheaper and United Package is more expensive. However this conclusion should not be taken seriously until we control for more variables. To do this I separated each delivery region into its own bucket and then did the same comparison. Results of this do indeed confirm that Speedy Express is often the cheapest option and that United Package is often more expensive. This conclusion still does not take into effect the speed and security of the delivery or the size of the package being delivered. At this point no business intelligence should be drawn from this analysis about which shipper to use.